Introduction: business without numbers = playing blind
An owner running a business without numbers is like a driver without a speedometer or a fuel gauge. The car seems to be moving, but nobody knows when exactly the fuel will run out.
It's the same in business: without a transparent system for tracking metrics, decisions are made intuitively. That works at the "small workshop" stage, but when a company grows you need data, or chaos eats the profit.
What an owner's dashboard is
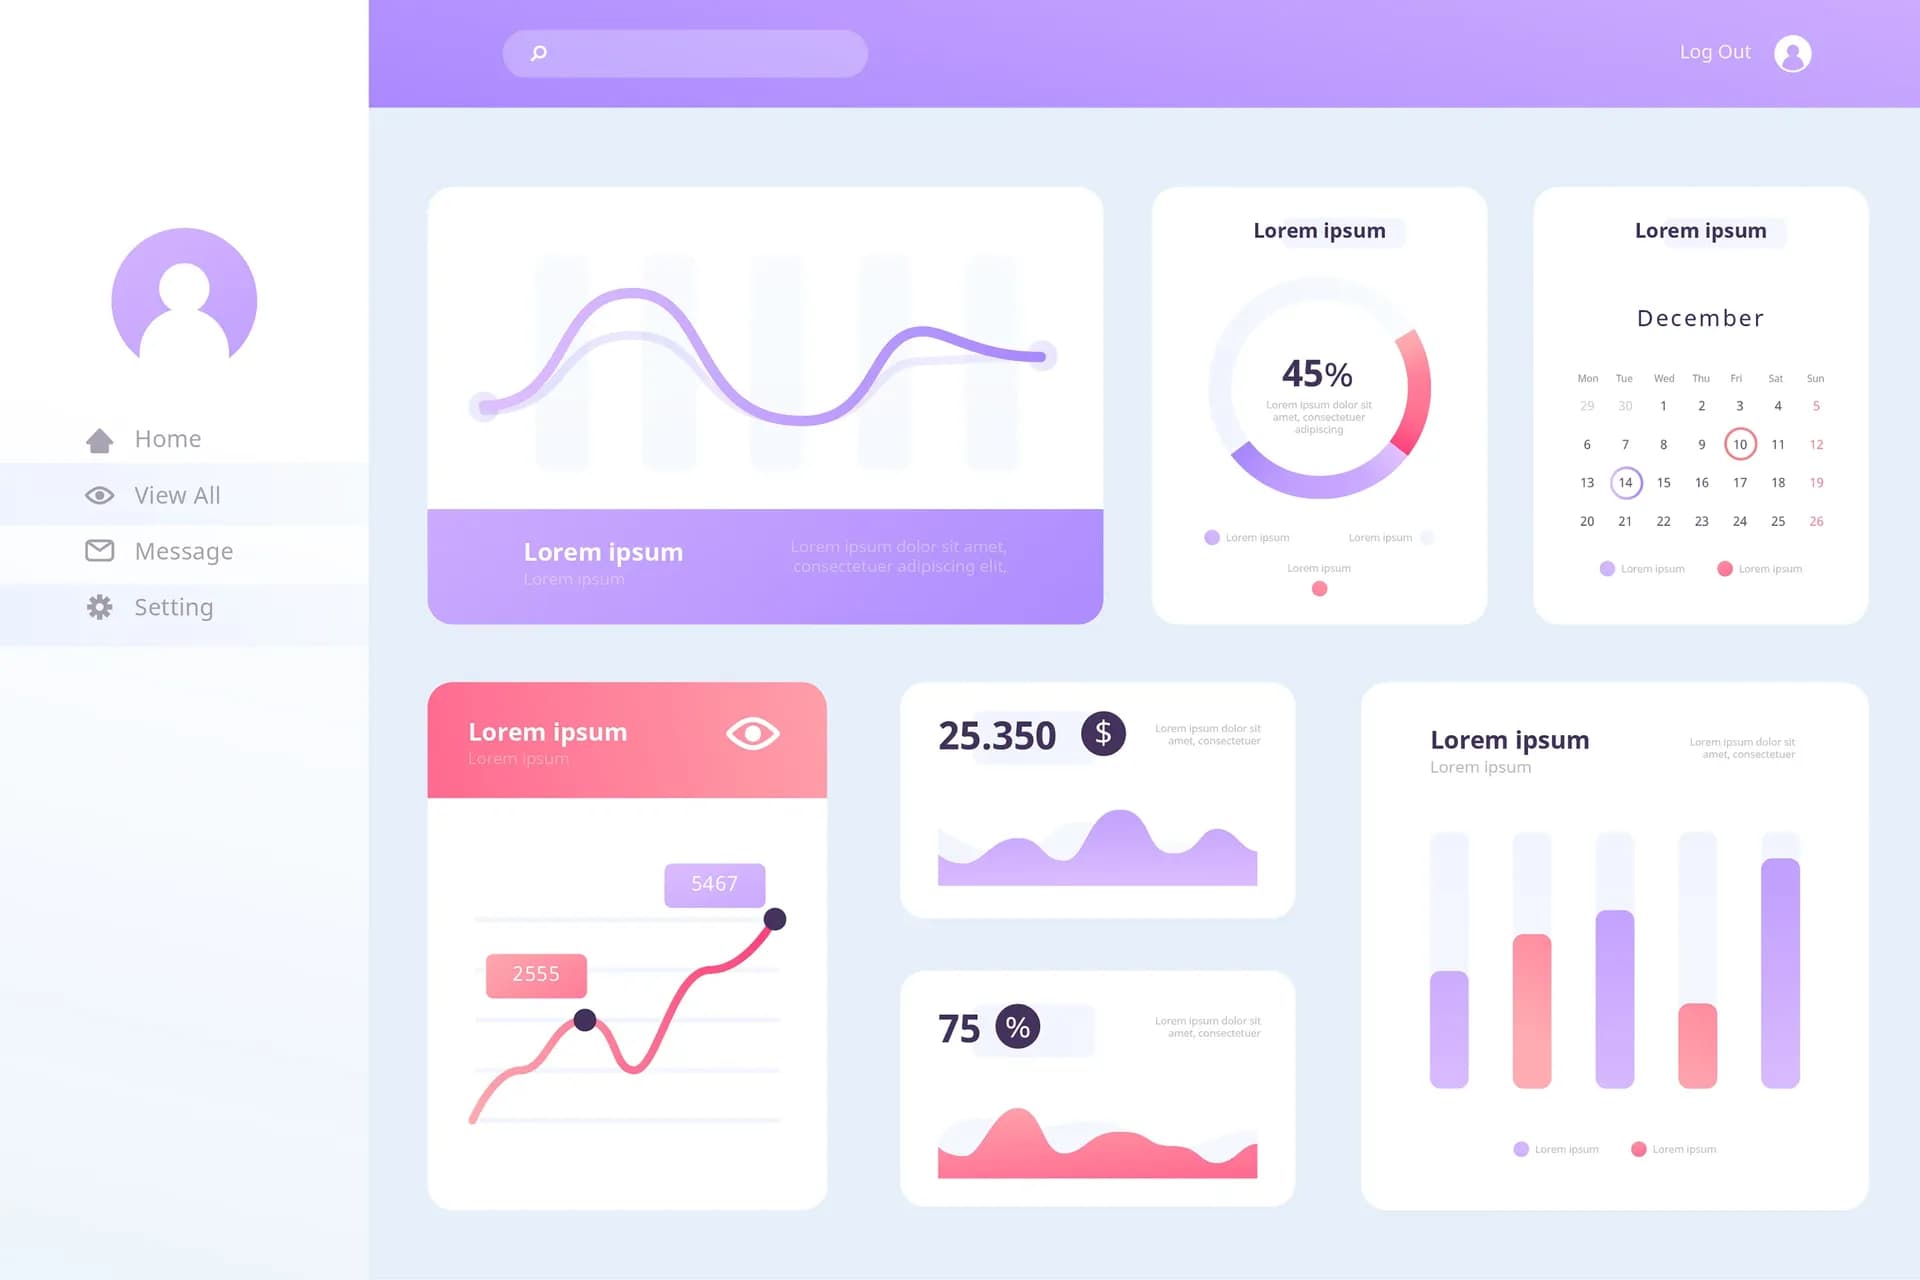
A dashboard is an interactive panel with key metrics. Unlike Excel, it:
- collects data automatically from the CRM, ERP and marketing channels,
- shows them in real time,
- visualizes the numbers as charts, tables and KPI indicators.
It's like moving from paper reports to a modern car with a digital dashboard. You see not only "the fact for last month" but also "what's happening now".
Excel vs an admin panel: what's the difference
Excel: good for a start
- works if you measure 2–3 metrics,
- formulas are easy to set up,
- cheap and quick to start.
But as the business grows, Excel becomes a problem:
- manual data collection → many errors,
- no real-time updates,
- integrations are hard to add,
- long reports that the owner often doesn't read.
Dashboard: a tool for scale
- data is pulled in automatically,
- integrations with the CRM, ERP, website and ads,
- updates every minute, not once a week,
- you can view any period with one click.
Example: we had a client who spent 6–7 hours every week on Excel reports from accounting and marketing. After a dashboard was implemented, he gets all the data in 30 seconds.
What an owner should measure weekly
1. Finance
Revenue, expenses, margin and net profit.
Excel often shows them with a delay, while a dashboard shows them in real time.
2. Sales
How many new leads, how many deals closed, what the average order value is.
In Excel you have to consolidate data by hand; in a dashboard it's pulled automatically from the CRM.
3. Marketing
Traffic, number of leads, customer acquisition cost (CPA).
Excel = copying data from Google Analytics or ads. Dashboard = an integration that works 24/7.
4. Operations
For eCommerce — the number of delivered orders. For a service business — the number of completed tasks. Excel may count this once a week, while a dashboard shows the live picture.
5. Team
KPI achievement, workload and even employee satisfaction levels (through internal surveys).
A practical example: Excel vs a dashboard
A law firm received 5 separate Excel files every week: from accounting, the marketer and the sales manager. The owner had to combine them by hand.
After a dashboard was implemented, he opens Power BI and immediately sees:
- how many clients came this week,
- what the revenue is,
- which ad channel works best.
Instead of "reading spreadsheets" he has time to make strategic decisions.
Why a dashboard is an investment, not a cost
Many businesses think: "Excel is free, why pay for a dashboard?"
But the truth is: if you spend 10 hours consolidating data by hand, that's lost profit. A dashboard pays for itself within the first months, because it saves time and shows the business's weak spots.
FAQ: what owners often ask
1. Can you start with Excel and then move to a dashboard?
Yes, that's a normal path. But it's better to switch when the number of metrics exceeds 10.
2. Is a dashboard hard to implement?
No, integration with the CRM, ERP and marketing is enough.
3. Which tools suit dashboards?
Google Data Studio, Power BI, Tableau.
4. Can a dashboard be tailored to a specific business?
Yes, it can be customized for any metrics.
Maybe don't delay and get some comfort?
Excel is fine for the first stage. But if the business grows, you need an admin panel with a dashboard. It's your control panel: you see finance, sales and marketing in real time, without extra files and errors.
👉 Book a consultation with Complex Agency and we'll help you set up an owner's dashboard that shows the true picture of your business every week.